The D.A.T.A. Project
For the data project we had to collect data about a topic of our choice. The requirements were to formulate questions for our topic then make graphs that correspond to the data. The graphs that were made were qualitative, quantitative, and bivariate graphs then made into final copies. For my final product, I am glad that it is over because it was tedious to make the graphs but very fun.
For my D.A.T.A. Project my theme was about Movies. Some questions that I had to ask my peers was what their favorite movie genre was, the average amount of money you spend every month on a movie, and many more questions that relate to my topic and the answers that I want to get.
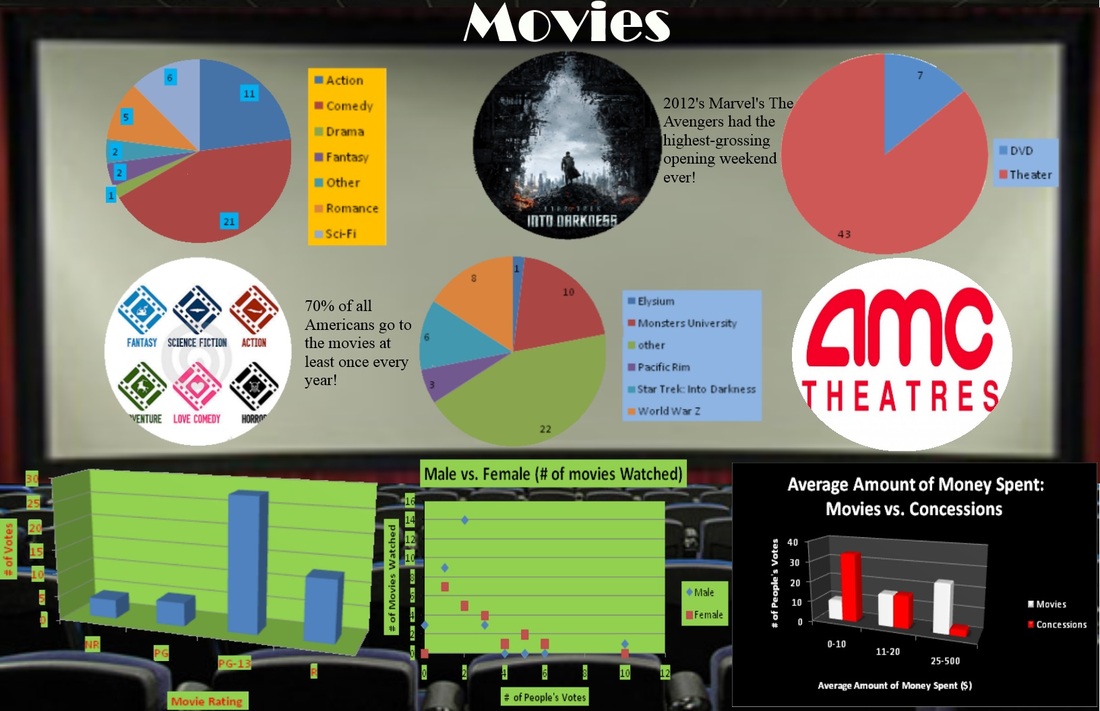
The conclusions that I found were very interesting were that 21 out of 50 students liked the movie genre of Comedy, Rated R movies was the second most watched genre behind PG-13 with 12 votes, and that the more money you spend on a movie could result in buying less food or drinks at concessions than normal.
